IIP growth surges to a 5-year high in October
Index of industrial production soared to a 5 year high in October, expanding 9.8% y-o-y as compared to 3.8% growth in the previous month. This sharp uptick was mainly on account of festive demand as well as the favorable base effect.
Double digit growth in the manufacturing sector (+10.7%), particularly capital goods (+16.1%) and consumer goods (+18.4%), helped drive up the industrial activity this month. While the capital goods sector has continued to grow in double digits for the fourth straight month, the surprise uptick in the consumer goods sector was largely on account of the sharp increase in consumer durables production (+42.2%) on account of the festive season. Basic goods, on the other hand, have continued to grow at 4.1% whereas intermediate goods production has inched up to 6.7% y-o-y in October
Activity in the mining and electricity sector also maintained a healthy pace, growing at 4.7% and 9% respectively in October 2015.
However, this increase does not reflect a definite recovery in industrial activity as it is mainly on account of festive demand and may reverse as early as the next month (November 2015
Wholesale and retail inflation inches up in November
Wholesale price, though deflationary, maintained the steady upward trend in November, inching up to -2% y-o-y as against -3.8% recorded in October. On a month-on-month basis, wholesale prices rose 0.5% over October.
Wholesale inflation stood at its highest since January 2015 mainly on the back of a pick up in price of primary articles, particularly food, despite the continued deflation in fuel prices. Food prices soared 5.4% in November 2015 after growing 2.4% in the previous month.
Retail inflation soared to a 5 month high in November, standing at 5.4% y-o-y, up from 5% in the previous month mainly on the back of the continued uptrend in food prices, which grew 6.1% y-o-y in November up from 5.3% in October. Among the food articles onions and pulses have been the main drivers of inflation this month.
However, this uptrend in inflation is in line with expectations as the favorable base effect wanes and considering the fact that 2015 was the second consecutive drought year. With this in view, a further cut in policy rates by the RBI may not be on the cards in the near terms as upward pressures to inflation exist not only from the supply side but also the demand side considering the impact of the 7th Pay commission on salaries and pensions.
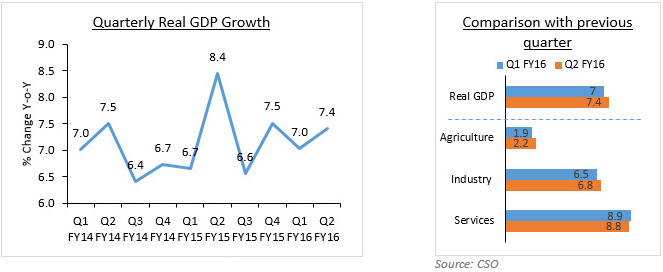
India's growth momentum gathers pace
India emerged as the fastest growing major economy in the world as GDP growth soared to 7.4% y-o-y in Q2FY16, up from 7% in the previous quarter. India's economic growth outpaced that of China, which grew at 6.9% y-o-y in the same quarter.
Taking a closer look at the breakup of GDP by economic activity we see that agriculture (2.2% y-o-y), manufacturing (9.3% y-o-y) and trade, hotels, transport, communication and services related to broadcasting (10.6% y-o-y) were the major sectors behind the uptick in growth this quarter. These three sectors collectively contribute more than 50% to the total gross value added and hence their significance in economic growth. On the flip side, performance of the construction sector has taken a major hit with growth falling to 2.6% y-o-y in Q2 FY16 as compared to 6.9% growth in the previous quarter and 8.7% growth in Q2 FY15. Growth of public sector and utility services has also faltered as compared to last year
On the expenditure side, GDP growth is mainly driven by a pickup in investments while consumption growth eased in Q2 FY16. Gross Fixed Capital Formation (GFCF), which indicates the overall investment activity in the economy, expanded by 6.8% y-o-y in Q2 FY16, up from 4.9% in the previous quarter and 3.8% in Q2 FY15. This is reflective of the sharp increase in public expenditure over the last few quarter, especially in road construction, even while private investments have continued to dwindle. Private consumption growth has inched lower in Q2 FY16, faltering to 6.8% y-o-y as compared to 7.4% in the previous quarter and 7.1% in Q2 FY15. This dip in consumption activity is expected to be short lived as the hike in salaries and pension according to the 7th pay commission, effective January 2016, will definitely boost consumer demand.
Current account deficit narrows to 1.6% of GDP
Current Account Deficit (CAD) shrank to USD 8.2 billion or 1.6% of GDP in July September2015 quarter as compared to USD 10.9 billion or 2.2% of GDP in the same quarter last year. However, on a sequential basis CAD was up from USD 6.2 billion or 1.2% of GDP in the Apr-Jun 2015 quarter.
The uptick in CAD on an annual basis was primarily on account of the lower trade deficit recorded in Jul-Sep 2015 quarter. Trade deficit stood at USD 37.4 billion as against USD 39.7 billion in the same quarter last year. However, the trade deficit in Q2 FY16 was a tad higher than trade deficit of USD 34.2 billion in Q2 FY16- thus leading to higher CAD.
Balance of payments was in the negative territory in the Jul-Sep 2015 quarter as there was a net drawdown of USD 900 million from the forex reserves as compared to a net accretion of USD 6.9 billion in the same quarter last year.
On the foreign investments front, net foreign direct investment to India dipped in Jul-Sep 2015 quarter to USD 8.2 billion from USD 8.8 billion in the same quarter last year. Also portfolio investments recorded a net outflow of USD 6.4 billion as against a net inflow of USD 9.8 billion in the year-ago period.